


WiD Pollen Explosion Edition! 💥
May 2025

Happy spring, friends!
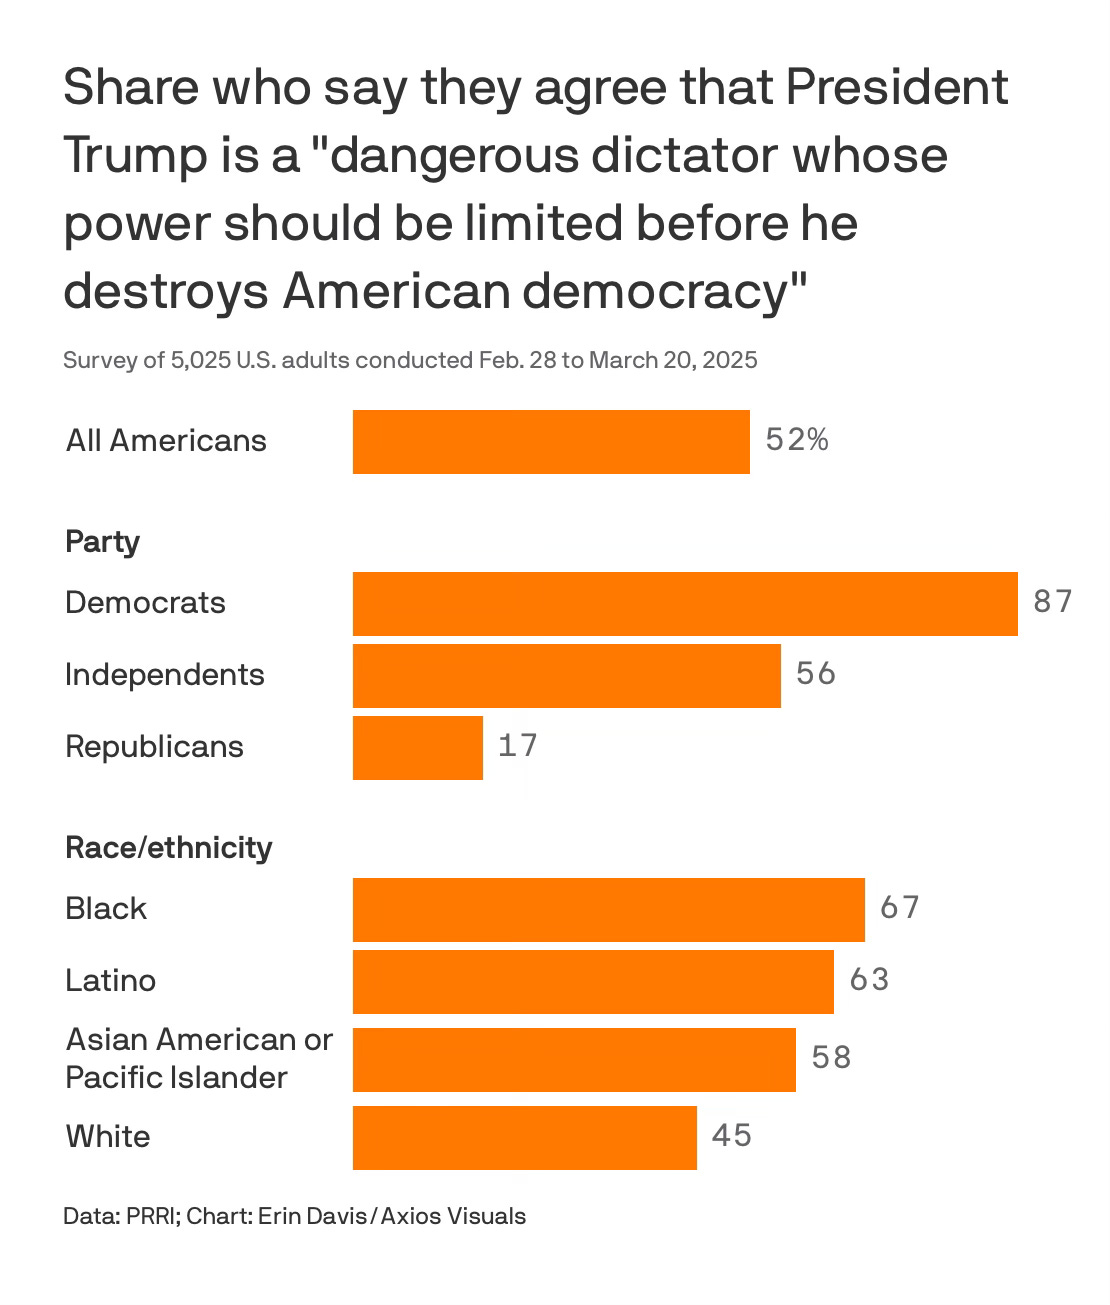
Here’s a chart I encountered “in the wild” last week, created by Erin Davis at Axios, followed by your regularly scheduled newsletter programming.
📆 Events
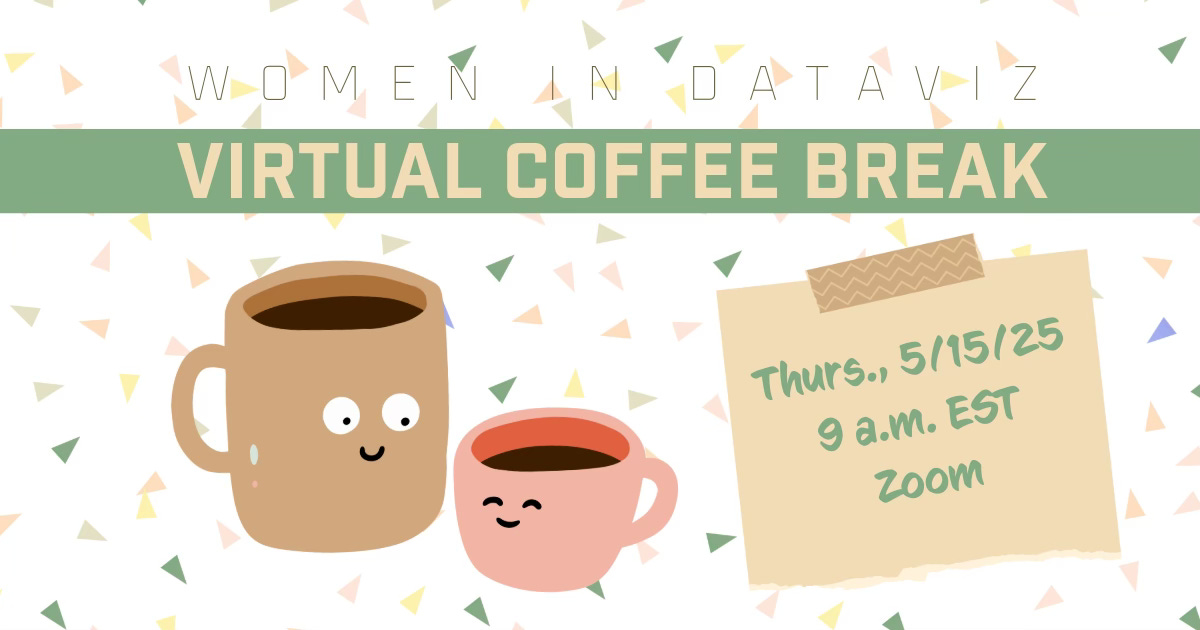
☕️ Virtual Coffee Breaks
Thursday, May 15, 9 AM EST, Zoom
Virtual Coffee Breaks are back and happening on the third Thursday of each month at 9 AM EST. Additional information here.
💼 Freelancers, Consultants, and Entrepreneurs Chat
Wednesday, June 4, 6 PM EST, The Chat Room, Discord
This new-for-2025 quarterly virtual meetup is intended for freelancers, consultants, entrepreneurs, and solopreneurs in data science, analytics, data engineering, and visualization. Bring your questions, successes, horror stories, and gripes! Join Discord here.
✏️Community Content
📋 Tableau User Group Women Speaker Database
Check out Kimly Scott’s super helpful database of women speakers in the Tableau community.
📋 Go behind the corkboard with Elisa Davis and Louis Yu!
I love hearing the personal stories behind people’s work, and I’m always curious about different approaches to creating data visualizations. This excellent conversation on Elisa Davis’s new blog, Viz & Tell, covers a bit of both.

✨ Inspiration
To live by my own values rather than the ones prescribed me by a culture that remains invested in my silence is a choice I must make every day.
Melissa Febos, Body Work: The Radical Power of Personal Narrative
🔨Tools to try
🌲Idle Forest🌲turns your unused bandwidth into real, live trees. All you have to do is browse as usual!1
💸Support the community!
Just $3.00 per month makes a big difference in meeting our operational expenses! If you have the means and inclination, sign up here!
Not a sponsored or affiliate link. I found it on Product Hunt!