☀️Women in Dataviz Mid-Summer 2024
Since I procrastinated until almost August, I decided to write a mid-summer newsletter, combining July’s and August’s. I obsessed over whether to use a hyphen for a long time, so I want to walk you through my reasoning. For your amusement, naturally.
The pro-hyphen argument
“Midsummer” could be confusing. In the U.S., we don’t celebrate Midsummer the holiday like European and Scandinavian countries do. (Or I think they do. Shit. I should’ve asked AI. But now I have the focus timer on and it will yell at me if I leave this page. European Women in Dataviz—please advise.)
In Shakespeare’s context, and in some cultural contexts, Midsummer is one specific day. I intend to convey the meaning that it is a season. Specifically the season containing July and August, because I procrastinated about finishing the July newsletter until today.
As I am writing this, at 2:53 PM on Thursday, July 25, I realized I could’ve just called it the Leo season newsletter. We’re data people, but we like astrology. (Or a lot of us do.)
The anti-hyphen argument
“Midsummer” looks nicer on the page. It evokes the idea of a celebration. The hyphen is such a staccato punctuation mark. (Don’t get it twisted—we all know I love an em dash, and sprinkle them liberally throughout my writing. It’s a relic from my English major days, I think.)
That’s all I’ve got for the anti-hyphen argument. The pro-hyphen argument is a stronger logical conclusion, so ugly hyphen it is.
According to The Farmer’s Almanac, “Midsummer celebrates the joy of long, warm days spent outside in the summertime. It’s held near the summer solstice—the first day of summer and the longest day of the year in the Northern Hemisphere—and is believed to be a period of good fortune and fertility. It’s especially beloved in Scandinavia, where the sky stays light into the night.”
Clearly, Midsummer was conjured up before climate change was a thing.
So this is not a Midsummer newsletter, because the holiday has passed and because I could not convince myself that “because it looks nicer” is an effective argument. So welcome to the Mid-Summer newsletter, as in pretty close to the midpoint of summer.
📆Events
Mid-summer is hoppin’ with dataviz-related events!
☕️ Virtual Coffee Break Break
Please note that Virtual Coffee Breaks are paused until the fall. We’ll resume our regular schedule with the October 10th 8 AM EST Coffee Break.
📚Data Book Club
The Data Book Club is reading ⚡️Chart Spark⚡️, a delightful and practical book for data visualization practitioners who want to cultivate their creativity through a dedicated practice, authored by the one and only Alli Torban.
The Book Club meets on August 2 and August 16 at noon EST/11 AM CST with Alli joining the second meeting for Q&A! See Brandi’s LinkedIn post here for more details.
I’m reading Chart Spark and highly recommend it so far. Alli also offers an accompanying course on the Data Literacy website, as well as a number of Data Viz Today episodes where she discusses the topic of creativity with several fascinating guests. (In fact, I devoured all of those episodes almost exactly two mid-summers ago.)
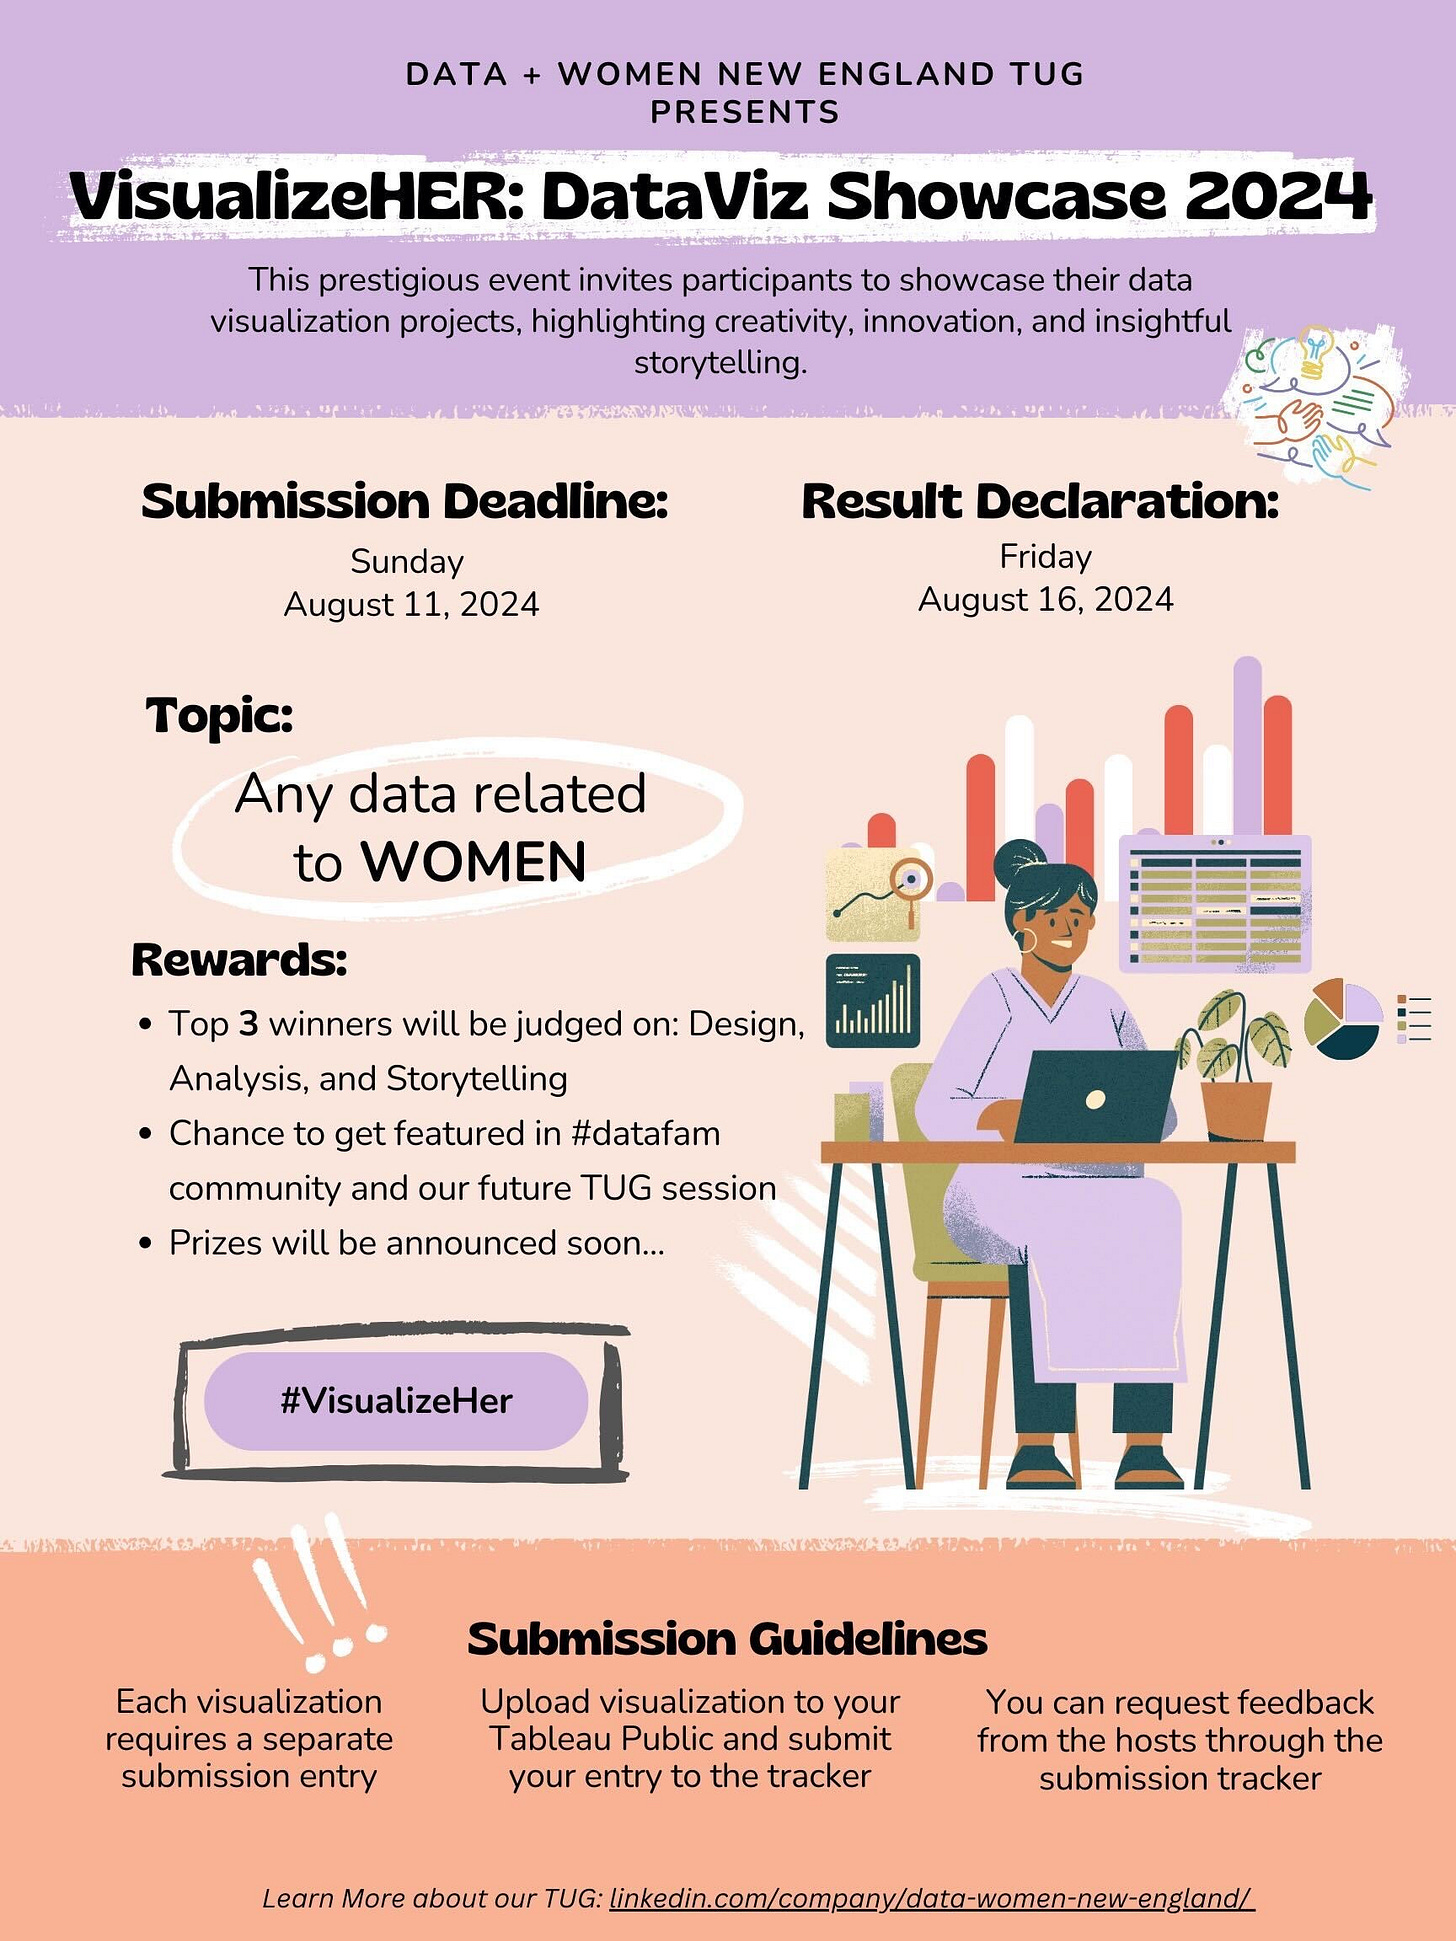
📊VisualizeHER: DataViz Showcase 2024
The Data+Women New England Tableau User Group is hosting a data visualization showcase! Visualize any data that tells women’s stories or affects women in some way and publish your work to Tableau Public by August 11. Let the team know you’re participating by completing this form.
👩💻The Vizness
Women in Dataviz have been busy creating amazing work this (mid-)summer. Nominate someone’s viz, writing, art, or other work to feature in the September newsletter!
🔎25 Years of Detective Conan Feature Films
DataKo published her contribution — 25 Years of Detective Conan Feature Films—to Tableau and IMDB’s Data+Movies project. (Catch her live streaming on Twitch if you have the opportunity!)
✒️115 Moments in Ink
Wendy Shijia documented her sketching from December of last year to June in this beautiful viz.
📺 Makeover Monday 2024 Week 30 — Streaming Hits 40% of U.S. TV Usage
Tableau Visionary and Tableau Public Ambassador Brittany Rosenau wrote a step-by-step guide to how she approached this week’s #MakeoverMonday community challenge. If you’re newer to Tableau, this post is an extra-helpful read.🔎
🖱️Counting Clicks: Are Pageviews Priceless or Pointless?
Like several web metrics, pageviews are only meaningful in context. Read my post here to learn why.
Community Member Offerings
Women in Dataviz community members get 30% off of Sarah Nell-Rodriquez’s Data Literacy Train the Trainer course by using the discount code WIDV30 at checkout.


